Selected Publications and Publication List

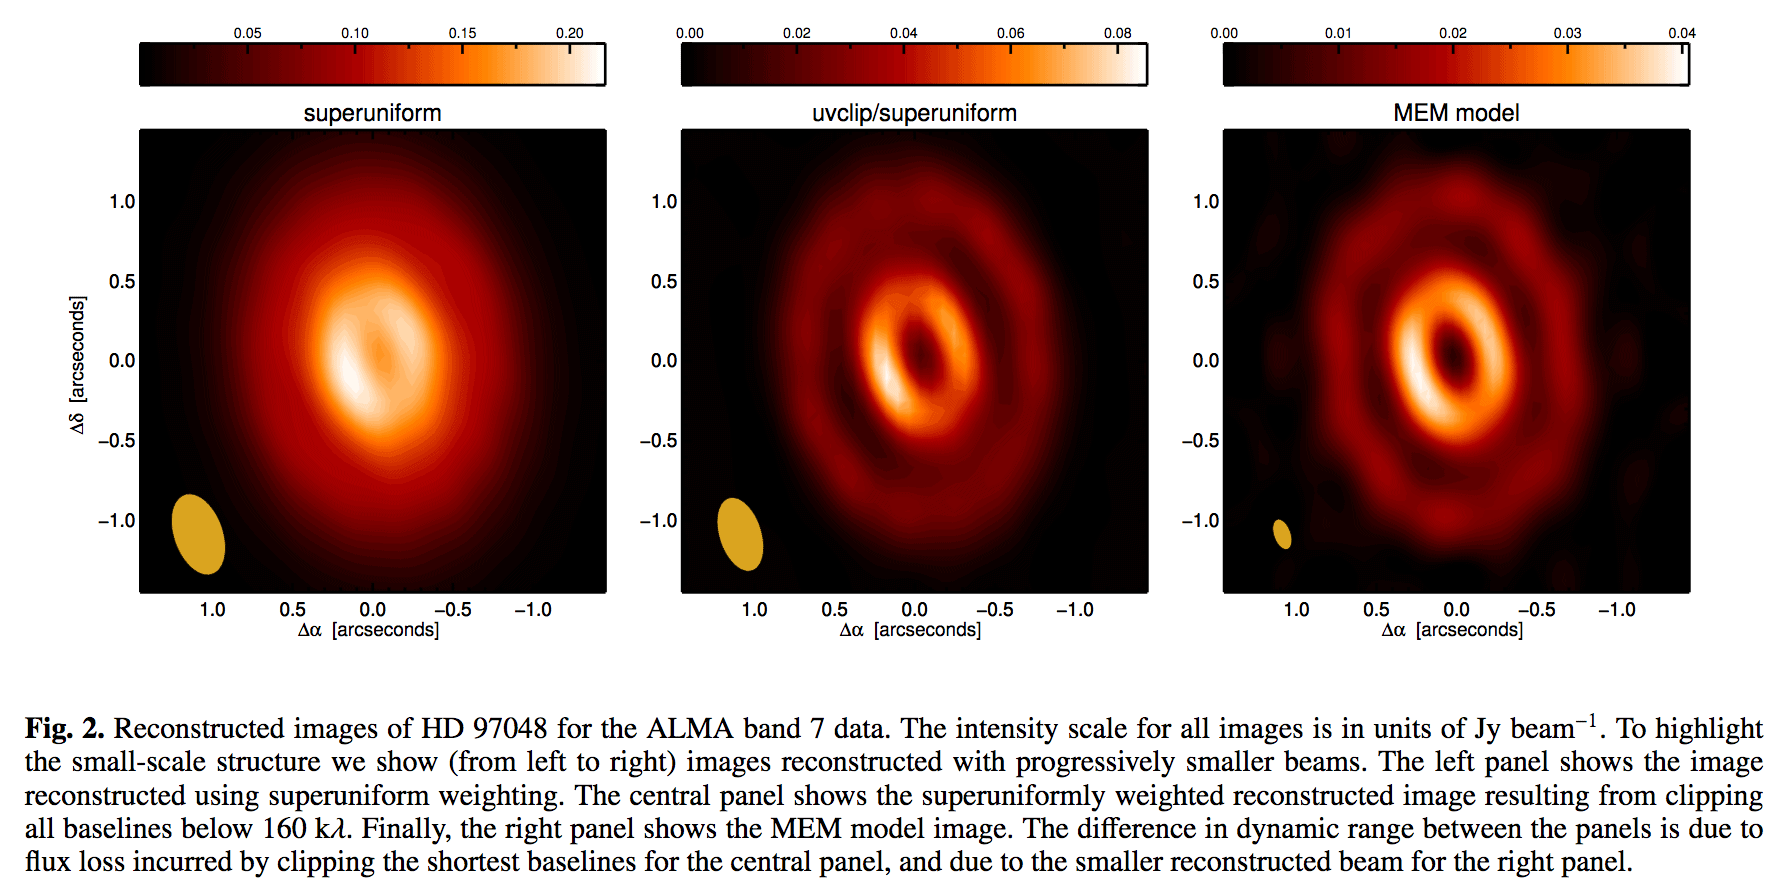
Cavity and further radial substructures in the disk around HD 97048

This work represents highlights on one of my favorite disks: the one around HD 97048. You can find ALMA cycle 1 and 2 data (band 3 and 7), including 12CO J=1-0, J=3-2, and HCO+ J=4-3, in this paper, as well as a bucket load of ATCA data.Highlights include and inner cavity of ~45 au radius, two rings in the outer disk, apparent non-Keplerian motions in the inner gas disk, clear signs of radial drift, and much more!
<ADS> | <preprint>
screen-shot-2016-09-24-at-11-57-41-am

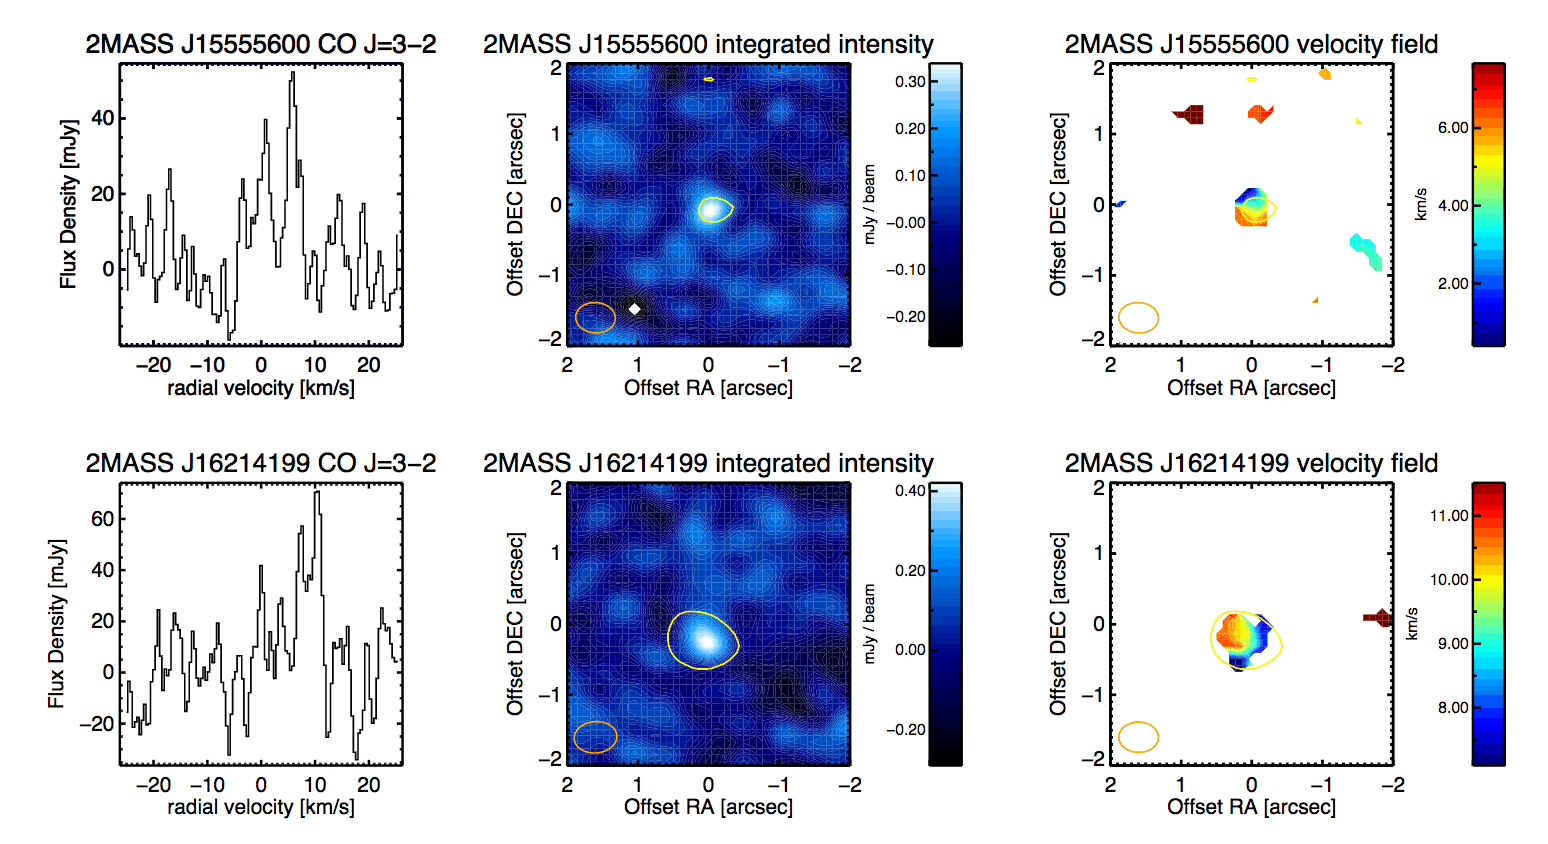
Dust Masses of Disks around 8 Brown Dwarfs and Very Low-mass Stars in Upper Sco OB1 and Ophiuchus

We detect unresolved continuum emission in all but one source, and the 12CO J = 3 – 2 line in two sources. We constrain the dust and gas content of these systems using a grid of models calculated with the radiative transfer code MCFOST, and find disk dust masses between 0.1 and 1 M, suggesting that the stellar mass/disk mass correlation can be extrapolated for brown dwarfs (BDs) with masses as low as 0.05 M. The one disk in Upper Sco in which we detect CO emission, 2MASS J15555600, is also the disk with the warmest inner disk, as traced by its H-[4.5] photometric color. Using our radiative transfer grid, we extend the correlation between stellar luminosity and mass-averaged disk dust temperature, originally derived for stellar mass objects, to the BD regime to < {T}{dust}> ≈ 22{({L}*/{L})}0.16 {{K}}, applicable to spectral types of M5 and later. This is shallower than the relation for earlier spectral type objects and yields warmer low-mass disks, and can mostly be attributed to the fact that BD disks have smaller disks, limiting the influence of the cold outer disk on the disk averaged temperature.

Summary figure for the two disks with detected CO J=3-2 emission. From left to right I show the intergrated cine profile, the integrated intensity (moment 0), and the velocity (moment 1) map.
Summary figure for the two disks with detected CO J=3-2 emission. From left to right I show the integrated line profile, the integrated intensity (moment 0) map, and the velocity (moment 1) map.

<ADS> | <preprint>

The structure of disks around Herbig Ae/Be stars as traced by CO ro-vibrational emission

We study the emission and absorption of CO ro-vibrational lines in the spectra of intermediate mass pre-main-sequence stars. The aim of our work is to determine the spatial distribution of the CO gas and its physical properties. We also aim to correlate CO emission properties with disk geometry. We find that the disk properties as traced by the SED has a large influence on the origin on the detected CO emission and on it’s excitation mechanism. CO emission from flaring (group I) disks is excited through UV fluorescence and traces emission at distances of typically 10 au. CO emission from self shadowed (group II) disks originates from closer (typically 1 au) to the star and appears to be in LTE. A natural explanation for these observations is the suggestion that our studied group I disks contain a central cavity, and that the detected CO emission originates from the inner rim of the outer disks, which is directly irradiated by the central star.
Boltzmann plots for 12CO (red) and 13CO (green) ro-vibrational emission lines from the disk around Herbig Ae/Be star HD 100546. These plots can be used to determine the rotational (~1100 K, each separate panel) and vibrational (~6800 K, between panels) temperature of the CO gas. The difference between both temperatures suggests a non LTE excitation mechanism

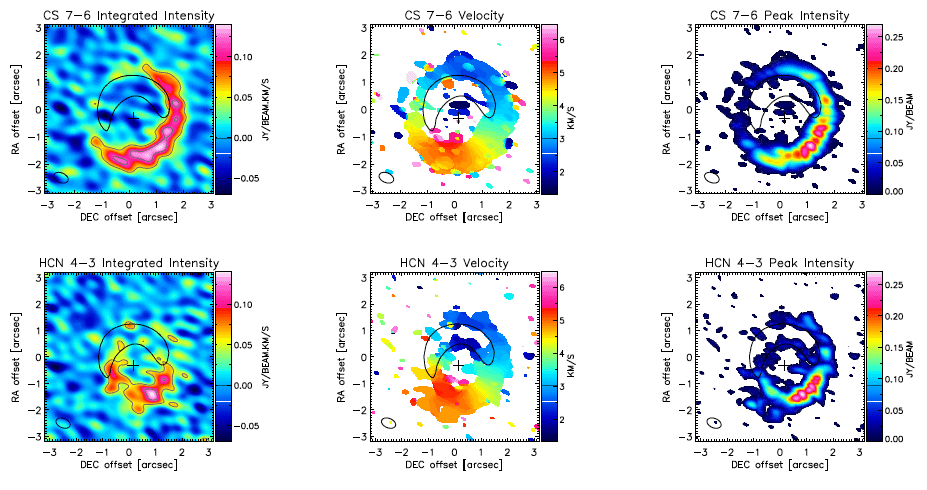
Spatially resolved HCN J=4–3 and CS J=7–6 emission from the disk around HD 142527

This letter is about spatially resolved ALMA detections of the HCN J=4–3 and CS J=7–6 emission lines. Both emission lines are azimuthally asymmetric and are suppressed under the horseshoe-shaped continuum emission peak. Possible mechanisms
to explain the decrease under the horseshoe-shaped continuum are [1] the increased opacity coming from the higher dust concentration at the continuum peak; [2] Lower dust temperatures associated with a locally increased average grain size and/or [3] an optically thick radio-continuum reduce line emission by freeze-out and shielding of emission from the far side of the disk.

<ADS> | <preprint>

CS J=7–6 (top row) and HCN J=4–3 (bottom row) integrated intensity (left), velocity centroid v(middle) and peak intensity Ipeak (showing the maximum intensity of the spectrum at each location, right). Overplotted on the integrated intensity map are intensity contours spaced at 3 times the noise level of this map (respectively 0.014 and 0.018 Jy km / s / beam for CS J=7–6 and HCN J=4–3). The v and Ipeak maps are obtained using all signal above 3 times the RMS as determined from individual channels not containing line emission. The position of the star is given by a plus sign and the beam is shown in the bottom left. With a black line we show the dust continuum emission at 30% of it’s maximum.
mid-IR fundamental CO emission excitation mechanisms. this is an example image and needs to be replaced with something more relevant.

The structure of protoplanetary disks surrounding three young intermediate mass stars. I. Resolving the disk rotation in the [OI] 6300 Å line

We probe the surface layers of the disks around 3 young intermediate mass stars using [OI] emission. We find evidence for shadowing by an inner rim in the disk surrounding HD 101412, and observe a flaring disk structure in HD 179218, while the [OI] spectrum of HD 135344 B is more complex. The [OI] emission starts for all three targets at velocities corresponding to their dust sublimation radius and extends up to radii of 10-90 AU.

<ADS> | <preprint>

Fundamental CO emission correlates with disk shape as expected in all but one aspect: Co emission in flaring disks does not trace the inner 10 AU

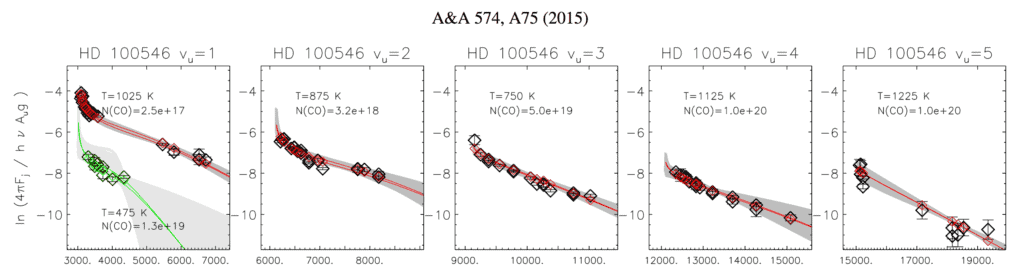
Evidence for CO depletion in the inner regions of gas-rich protoplanetary disks

We study CO gas in the disks around HD 97048 and HD 100546 using mid-IR spectro-astrometry. We resolve, spectrally and spatially, the emission of the 13CO v(1-0) vibrational band and the 12CO v = 1-0, v = 2-1, v = 3-2 and v = 4-3 vibrational bands in both targets, as well as the 12CO v = 5-4 band in HD 100546. Modeling of the CO emission with a homogeneous disk in Keplerian motion, yields a best fit with an inner and outer radius of the CO emitting region of 11 and ≥100 AU for HD 97048. HD 100546 is not fit well with our model, but we derive a lower limit on the inner radius of 8 AU. The fact that gaseous [OI] emission was previously detected in both targets at significantly smaller radii suggests that CO may be effectively destroyed at small radii in the surface layers of these disks.

<ADS> | <preprint>

Complete list of publications on ADS

You can find a complete list of all my publications on the ADS website.